Inequity revisited
I recently posted an examination of a simple, little, random game.
I decided that I wanted to look a little deeper.
If you didn’t read that post, please take a look now.
Just as a reminder, here is the setup and rules for the game:
Setup:
- We’re going to start off the game by gathering 1000 people together.
- We’re going to give each person 100 small pebbles in a cool, stylish drawstring bag. Perhaps it will be monogrammed. Who knows…
- We’re going to set up a timer that will, annoyingly, beep once every second.
- The game will last for 8 hours.
Rules:
- With every annoying beep of the timer, each person is to - completely randomly - choose another person, and give them a pebble.
That’s it. Nothing more. It’s about as simple as you can make a game…
Remember: Each person randomly chooses someone else (not themselves) to give a pebble. On every turn, every person in the game gives away one pebble, but - because the choices are truly random, every person has the exact same chance (as every other person) of being the recipient of one or more of the 999 other pebbles that are given away.
I asked readers a question: at the end of eight hours, what will the distribution of pebbles look like?
I’m pretty sure that very few people would have predicted that it would look like this:

Despite the fact that all of the choices in the game are completely fair and random, the outcome of the game seems to be anything but fair:
- Some people end up with a crap-tonne of pebbles
- Some people end up with no pebbles at all
- This distribution is the result of the game every time.
- Every. Damned. Time.
This result was pretty counter-intuitive for me, and I said so. I also pointed out that the graph produced from the results of the game looked remarkably similar to a graph showing the distribution of U.S. Household Income by Percentile.
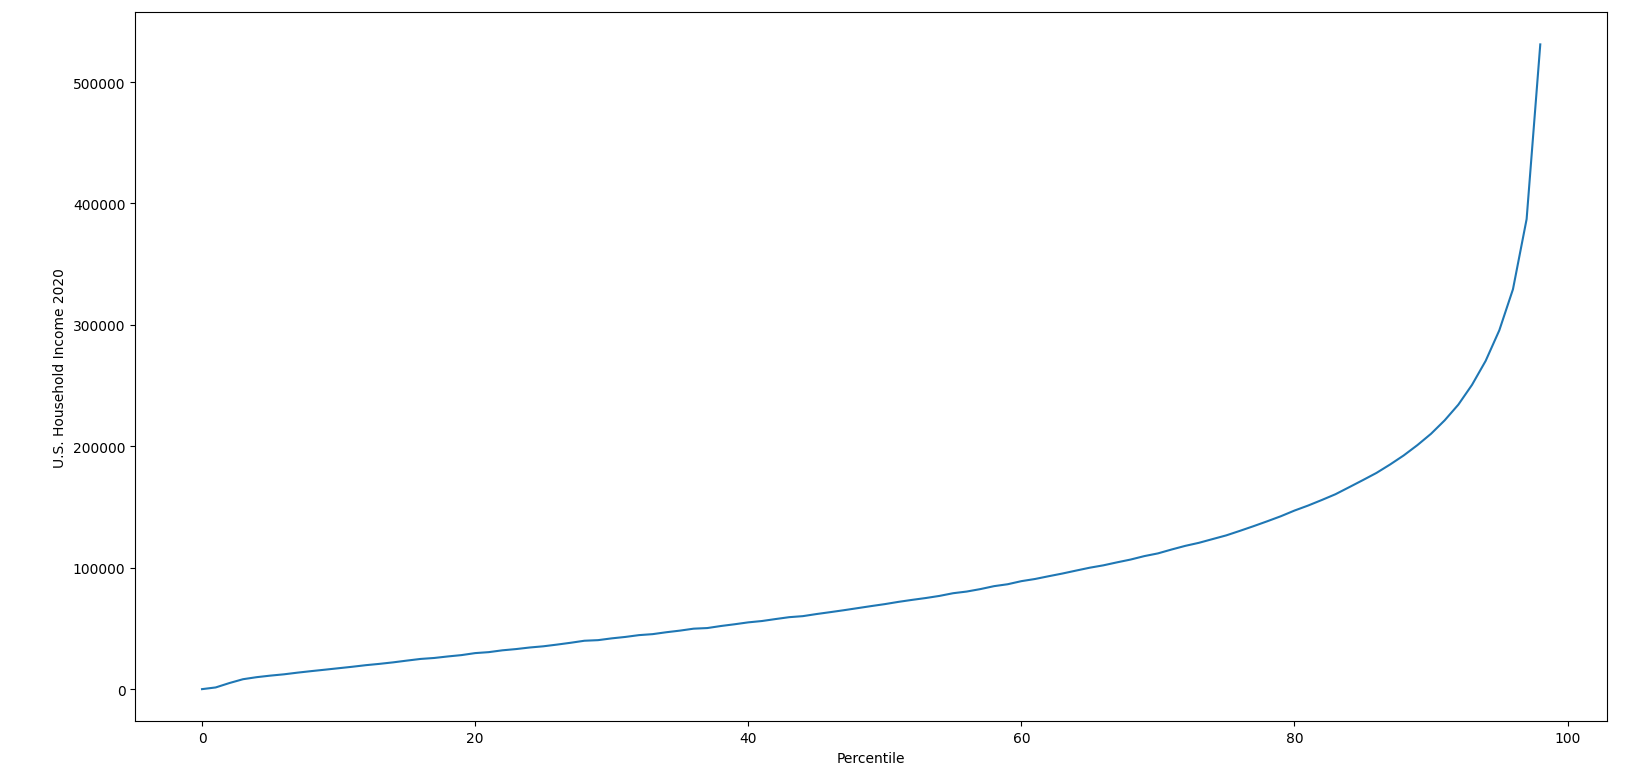
I took pains to point out that it was likely an enormous mistake to draw any conclusions based on the similarity of these two graphs.
Then I went ahead and drew conclusions based on the similarity of these two graphs.
I’m like that…
I closed out the blog post by saying this:
All of the inequity in the result of our game arises from a perfectly fair system; in the simulation, the people who win are randomly different every time. Imagine the results if you threw in even the smallest amount of systemic unfairness…
But I can’t just make a sweeping statement like that without… you know… testing it.
So, I did.
Let’s take a look at that first assumption - that the people who win in the original version of the game are just randomly lucky, i.e. that overall, despite the outcome being unfair, the distribution of who wins is fair.
[Note: If you’re not familiar with programming or Python, feel free to just skip the code - it’s simply simulating the game as described above. Any additional information is explained below. I only include the code for folks who want to play around with this stuff on their own…]
#!/usr/bin/env python3
import random
from datetime import datetime

# choose a random seed
random.seed(datetime.now().timestamp())

people = {}
averages = []

# we begin with 1000 people, each with 100 pebbles
for i in range(1000):
    people[i] = 100

# let's play the game 100 times...
for k in range(100):
    # every second, each individual picks a random person and gives them one pebble
    for i in range(3600 * 8):
        for p in range(len(people)):
            r = p
            while(r == p):
                r = random.randint(0, len(people) - 1)
            if people[p] > 0:
                people[p] -= 1
                people[r] += 1
    # let's pull out the values so we can easily sort them...
    values = []
    for p in range(len(people)):
        values.append(people[p])
    # sort the results, lowest to highest
    values.sort()

    count = 0
    sumval = 0
    for p in range(len(people)):
        if people[p] >= 100:
            count += 1
            sumval += p
    print('Run #%3.3i: sum: %i count: %i average: %f' % ((k + 1), sumval, count, (sumval / count)))
    averages.append(sumval / count)
# now, let's do a little statistical math...
avg = sum(averages) / len(averages)
var = sum((x - avg)**2 for x in averages) / len(averages)
std = var**0.5
print('Overall: average:%f variance: %f std_deviation: %f' % (avg, var, std))
I reworked the original game simulation code a bit to run the game in a loop, 100 times. For each run, I pulled out a list of the people who won the game - which I defined as those who ended up with 100 or more pebbles. I calculated the average of their ID Numbers (which ranged from 0 - 999). If the winning group was fairly distributed, the average of those values should have been right around 500 (actually, 499.5, but that’s just me nitpicking…). I gathered the average value for each of the 100 runs, and did a little statistical calculating… averaging all of the averages and calculating their standard deviation. What I found was the following:
average:499.543340 variance: 148.283085 std_deviation: 12.177154
My sample size (100 games) is probably a little small, but overall, it’s showing pretty much what I predicted.
So, what happens if we throw even a tiny bit of systemic unfairness into the mix? What happens if as little as 1% of our population decides that doesn’t like a specific 10% chunk of the population - and refuses to give them a pebble? How might that skew the results?
#!/usr/bin/env python3
import random
from datetime import datetime

# choose a random seed
random.seed(datetime.now().timestamp())

people = {}
averages = []

# we begin with 1000 people, each with 100 pebbles
for i in range(1000):
    people[i] = 100

# let's play the game 100 times...
for k in range(100):
    # every second, each individual picks a random person and gives them one pebble
    for i in range(3600 * 8):
        for p in range(len(people)):
            r = p
            while(r == p):
                if p >= len(people) - (len(people) * 0.01):
                    r = random.randint(len(people) * 0.10, len(people) - 1)
                else:
                    r = random.randint(0, len(people) - 1)
            if people[p] > 0:
                people[p] -= 1
                people[r] += 1
    # let's pull out the values so we can easily sort them...
    values = []
    for p in range(len(people)):
        values.append(people[p])
    # sort the results, lowest to highest
    values.sort()

    count = 0
    sumval = 0
    for p in range(len(people)):
        if people[p] >= 100:
            count += 1
            sumval += p
    print('Run #%3.3i: sum: %i count: %i average: %f' % ((k + 1), sumval, count, (sumval / count)))
    averages.append(sumval / count)
# now, let's do a little statistical math...
avg = sum(averages) / len(averages)
var = sum((x - avg)**2 for x in averages) / len(averages)
std = var**0.5
print('Overall: average:%f variance: %f std_deviation: %f' % (avg, var, std))
This changes the code so that 1% of our population (just ten folks with ID Numbers 990-999) will not give a pebble to a specific 10% of the population (any one of the 100 people with the lowest ID Numbers, down in the range 0-99).
If I’m correct in my assumption that even a small amount of systemic unfairness will skew the result, then the average ID Number of the winning cohort should rise (by forcing some of those people with low ID Numbers out of the winning cohort). But will this small amount of systemic unfairness (only 1% of our population) create a statistically significant change?
Let’s take a look at the overall distribution of pebbles that results from one run of this new 1% systemic unfairness paradigm:

Nothing has changed in the distribution:
- Some people ended up with a crap-tonne of pebbles
- Some people ended up with no pebbles at all
What did change was who got to be in the winners category. Here’s the results for 100 runs:
average:544.126954 variance: 118.185653 std_deviation: 10.871323
Fewer of the folks in the 0-99 range got to be a winner, raising the average ID Number of the winners by 44 points - well beyond the standard deviation of both sets of results, meaning that yes, indeed, this is a statistically significant change.
And, unfortunately, all of this was driven by only 1% of the population.
All of the inequity in the result of our game arises from a perfectly fair system; in the simulation, the people who win are randomly different every time. Imagine the results if you threw in even the smallest amount of systemic unfairness…
Now, there’s no need to imagine.
-TL
Tom Liston
Owner, Principal Consultant
Bad Wolf Security, LLC
Mastodon: @tliston@infosec.exchange
Twitter: @tliston
April 26, 2021